Background
It is natural that cultural and environmental sustainability enjoy some synergy. Although museum professionals have begun to pursue sustainability strategies, there are aspects of museum practices established over the past 60 years that make intensive use of energy, supplies, and solvents, many of which are hazardous to conservation professionals. Some of the least sustainable practices are associated with loans and temporary exhibitions that require short-term use of materials, while heating, cooling, dehumidifying, and lighting of storage and exhibition spaces within a narrow band of environmental conditions is highly energy-intensive.
The tremendous financial pressure on museums to increase loan activity simultaneously increases energy demands and materials use, involving extensive packing systems to safely ship fragile, valuable artifacts. Additionally, transporting artifacts can involve long distance shipping by truck, air or ship, often internationally. The high economic, cultural and educational value placed on providing national and international accessibility to objects means that the practice of loaning will continue for the foreseeable future. This reality calls for the development of sustainable approaches to the transport and exhibition of art so that, as natural resources dwindle, practices are in place that will allow us to responsibly continue caring for and providing access to our cultural heritage. Additionally, due to limited virgin resources, the cost of packing and transporting art will continue to rise, eventually limiting the ability of most institutions to bring together exhibitions of objects from diverse global collections. By identifying hotspots in loan activity, we can consider new more sustainable practices that will allow for continued loans, reducing costs as well as environmental impact.
There have been several notable efforts to assess the sustainability of loans and exhibits. Simon Lambert’s research based in the National Museum, Wales, was one of the first studies to address the carbon footprint of a museum loan (Lambert 2010). More recently, individual artists, galleries, and museums have begun to publish carbon footprints, aided by online tools that have been developed for this purpose. For example, Julie’s Bicycle has published a set of “Creative Green Tools”, including a carbon calculator and reporting tool that has been used by more than 5,000 organizations, while another carbon calculator developed by the Gallery Climate Coalition has also seen widespread adoption. Individual footprints such as that conducted by the environmental design consultancy atelier10 for David Zwirner have also highlighted the large emissions contributions of transportation and building energy use, encouraging others to include these in the scope of their analyses (atelier10 2021). The sector is starting to see decarbonization recommendations and roadmaps to guide institutions in taking steps to reduce emissions where possible, through measures such as reducing freight transport, reusing and repurposing exhibition sets and crates, and extending the length of shows (Gill, 2022).
Many of these early efforts by museums and allied organizations have focused on footprinting: simply counting the energy use, water use, or greenhouse gas emissions that occur at museum facilities (direct inputs or emissions) as well as emissions that are embodied in the goods and services that museums purchase (indirect inputs or emissions). These simple metrics may not capture all of the environmental concerns of museums, but they are relatively easy to calculate and can often be based on utility bills. Energy, water, and carbon footprints are also often correlated with more complex sustainability metrics, such as toxic air pollution or public health impacts, so they provide a good starting point for many organizations seeking to measure sustainability in some way.
Footprinting is a sub-tool within the larger modeling framework of life cycle assessment (LCA), so named because it considers environmental impacts that occur both directly and indirectly (up and down the supply chain) from a facility, process, or product. LCA is used around the world in a wide range of sectors to quantify sustainability along multiple dimensions or impact categories using a standardized protocol. LCA is most commonly applied to make decisions regarding product design and process improvements and to compare multiple options. LCA is designed to answer the familiar question, “which is the greener choice?” in a comprehensive way, considering both human health and the environment.
In 2013 The American Institute for Conservation of Artistic and Historic Works (AIC) sponsored a research project to analyze traditional approaches to museum and art conservation activities. Several LCA research studies were carried out with the Museum of Fine Arts (MFA), Boston, in collaboration with Northeastern University, based on MFA activities and energy use. LCA was used to analyze a number of museum activities, including heating and cooling systems, traveling loans, exhibition preparation, gallery maintenance, and options for lighting galleries. These studies were later published as an article in the Journal of the American Institute for Conservation (JAIC) (Nunberg et al. 2016). This Case Study summarizes the results of that article and illustrates the use of the LCA as a tool for the evaluation of materials and processes used in the display, transport, and preservation of cultural heritage. Additional details can be found in the original article.
The LCAs in this study aim to provide information for cultural institutions to implement more sustainable practices while keeping in mind their overall mission to provide a public audience with the opportunity of experiencing cultural heritage in person. This is the function of an exhibit: not only to provide an institution with revenue, but to provide the public with the knowledge attained while personally viewing artifacts from a collection. This study strives to develop viable options, which allow the display and loan of cultural heritage, while preserving limited natural resources far into the future.
LCA Modeling
Life cycle assessment (LCA) is an internationally standardized (ISO 14040) modeling tool commonly used to quantify environmental and health impacts of a product or process (International Organization for Standardization 2006). LCA takes a holistic, systems approach by considering sustainability over the entire product life cycle, including raw materials extraction, manufacturing, transport, use, and end-of-life (Vigon et al. 2020; Fava and Society of Environmental Toxicology 1991; United Nations Environment Programme 2005). LCA has been implemented across all types of sectors to inform design and procurement decisions, and provides the scientific basis for all carbon, water, and environmental footprinting. For example, popular online calculators use LCA to compare different grades of paper or packaging materials (Environmental Paper Network 2021; sphera 2020).
For this case study, material and energy use data gathered at MFA Boston were compiled into an LCA model using the commercial LCA software platform SimaPro 7.3 and linked to the life cycle inventory database ecoinvent 2.2, which contains generic information on the life cycle of many materials and processes, including embodied carbon factors. Global warming impacts (or carbon footprint, measured in kilograms of carbon dioxide equivalents, kg CO2e) were calculated using the Tool for the Reduction and Assessment of Chemical and other environmental Impacts (TRACI v2.1) impact assessment method developed by the U.S. Environmental Protection Agency (U.S. EPA 2012). Further information concerning LCA tools and methods can be found in the STiCH Introduction to LCA Information Sheet.
LCA compares processes not by mass or volume but according to the common function they fulfill, called the functional unit – this is a quantitative measurement that allows for fair comparisons between options. While the function of art is a philosophical question with a deep discourse, for the purposes of this study, it was taken to be the number of expected views for an entire exhibit based on the average number of annual visitors to an art museum in Tampa (12,500) and in Nagoya (120,000). The data for the case study were gathered prior to 2013 and absolute values will have shifted in the intervening period; however, the relative contributions to GHG emissions of different processes throughout the loan processes are still relevant today.
Methods
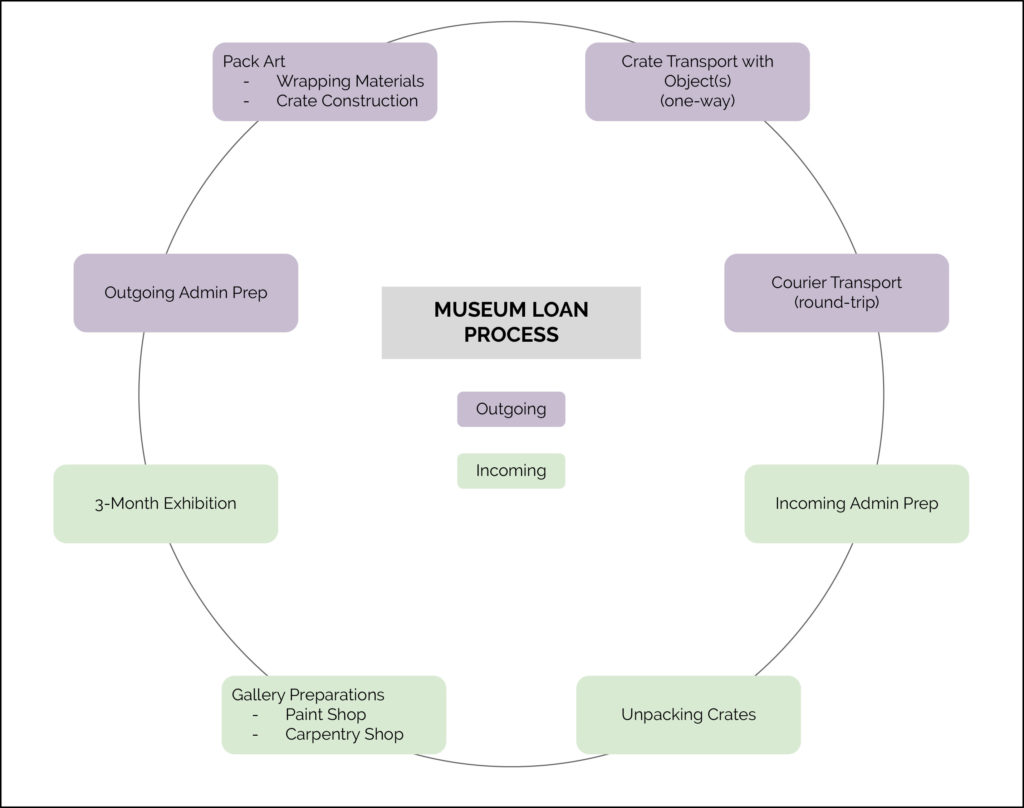
This case study evaluates the environmental impact of loan operations at MFA Boston, split into two parts: incoming loans that are put on exhibit in Boston, and outgoing loans to other institutions (Figure 1). Specifically, the study analyzes the impact of an incoming loan of 30 crates and outgoing loan scenarios of one crate to either Nagoya, Japan or Tampa, Florida. Results are scaled to show GHG emissions, or carbon footprint, measured in kilograms of carbon dioxide equivalents (kg CO2 eq), of both types of loan operations on a per crate basis. For incoming loans, the study considers emissions related to administrative work, unpacking crates, gallery preparations, and repacking the crates for a three month exhibition. The carbon footprint calculations of outgoing loans includes crate construction and packing materials for the objects, transportation of the packed crates, courier travel, and administrative work.
INCOMING LOANS AND EXHIBITS
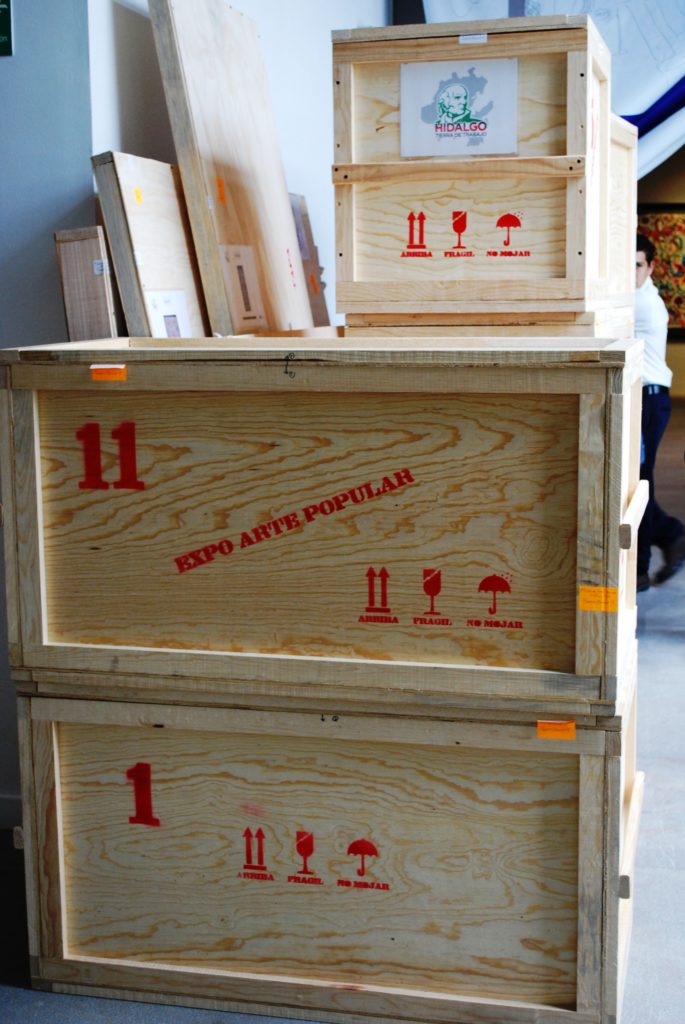
Image credit: Thelmadatter, CC BY-SA 3.0 via Wikimedia Commons.
Once unpacked, incoming crates are stored on-site in a climate controlled setting or placed in off-site storage with no environmental controls. Incoming crates are assumed to be 152 x 102 x 38 cm. Based on information collected through interviews with MFA staff, the off-site crate location is a warehouse 12 miles from the museum with an estimated power usage of 1 watt/square foot. The on-site crate storage location has an estimated power usage of 4 watts/square foot.
Gallery preparation is assumed to require a 12-pack of caulk, 100 gallons of alkyd paint, and 6.6 pounds of joint compound tape. Electricity, water usage, and cleaning requirements for the space were tracked over a three-month period for the gallery. An inventory of other preparation materials such as Dibond®, Medium Density Overlay (MDO), and fasteners for creating display cases was kept, and water and electricity consumption of the paint and carpentry shops where exhibition cases and Plexiglas™ vitrines construction occurred were also incorporated in the study. Administrative duties for both the incoming and outgoing loan processes are tracked by electricity usage in the registrar’s office and throughout object conservation.
Once the exhibit is over, the loaned objects are repacked for the return trip back to the loaning institution. The crate shell is modeled with dimensions of 150 x 100 x 33 cm of kiln-dried plywood. Crate edges are lined and braced with pine. Epoxy resin is used as an adhesive to seal the crate, and the fasteners and hinges are made from stainless steel. The model assumes the crates are packed to contain any number of objects the Boston-based museum deems fit safely inside and that objects are soft packed. Soft packing uses foam products including ester foam, open and closed cell polyethylene, high-density polyethylene (HDPE) and low-density polyethylene (LDPE) sheet, cardboard, foam core, and hot glue. A new set of soft packing materials are assumed to be needed for the delivery and return of the objects. Transport distances of the foam from the distributor in Hartford, CT to Boston, MA using the most direct land and air routes available were included in the study. The crates used for this study are based on a design used by MFA Boston in 2013; for a more detailed investigation of crate designs, please see the STiCH Crates Case Study.
OUTGOING LOANS
Outgoing loans of a single crate are modeled through the following shipping scenarios: by plane to Nagoya, Japan and by plane and truck to Tampa, Florida. The crate design is as described above for repacking the incoming loans. Freight and passenger plane options were investigated for both destinations. The shipment of a single crate is modeled to be handled by one courier, who travels two round trips for each exhibit.
As this case study provides a big picture analysis of the carbon footprint embodied in a loan between cultural heritage institutions, the weight and number of the object(s) being transferred and displayed and the disposal of products at the end of their lifetime were excluded from the study scope.
Results
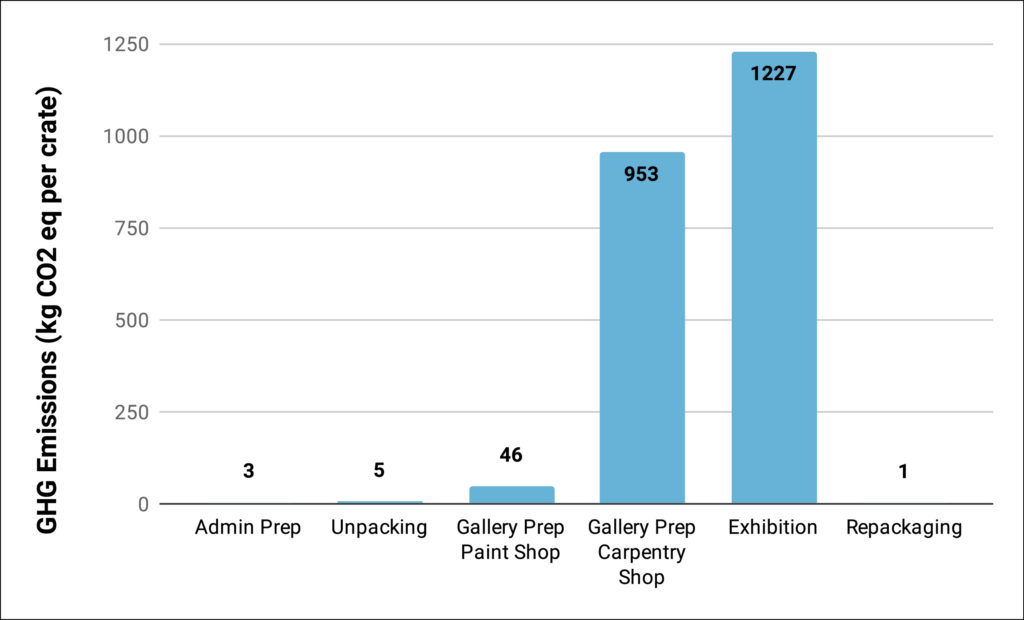
Analysis of incoming loans is shown on a per-crate basis in Figure 2. Building energy use for running the exhibition is the largest contributor to the carbon footprint with 1227 kg CO2 eq for the incoming loan. This result was corroborated by the more recent atelier10 study (2021) that found that building energy use also accounted for approximately half of the total. GHG emissions related to gallery preparation in the museum carpentry shop are also high, contributing 953 kg CO2 eq per incoming loan. Within the carpentry shop, the most substantial source of GHG emissions comes from exhibit case materials. This contribution could be notably reduced by reusing Plexiglas™ case material, as it has a high carbon intensity. When this data was gathered in 2013, the carpentry shop typically reused 40% of the Plexiglas™ after each exhibit and recycled the other 60% of the material. The unpacking of an incoming loan, administrative preparations, and repacking crates for the loaning institution made relatively small contributions to the overall carbon footprint.
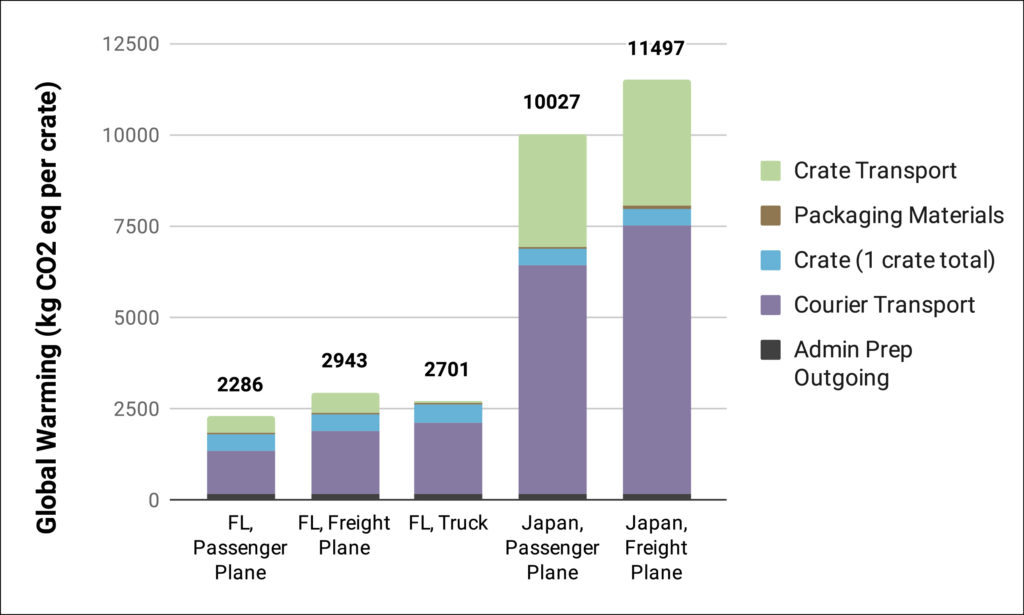
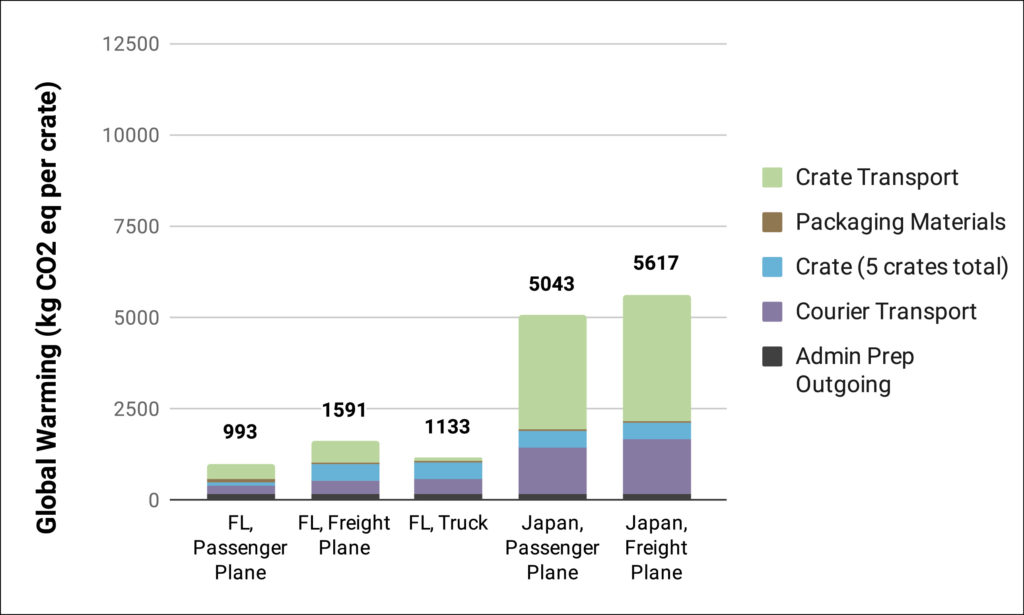
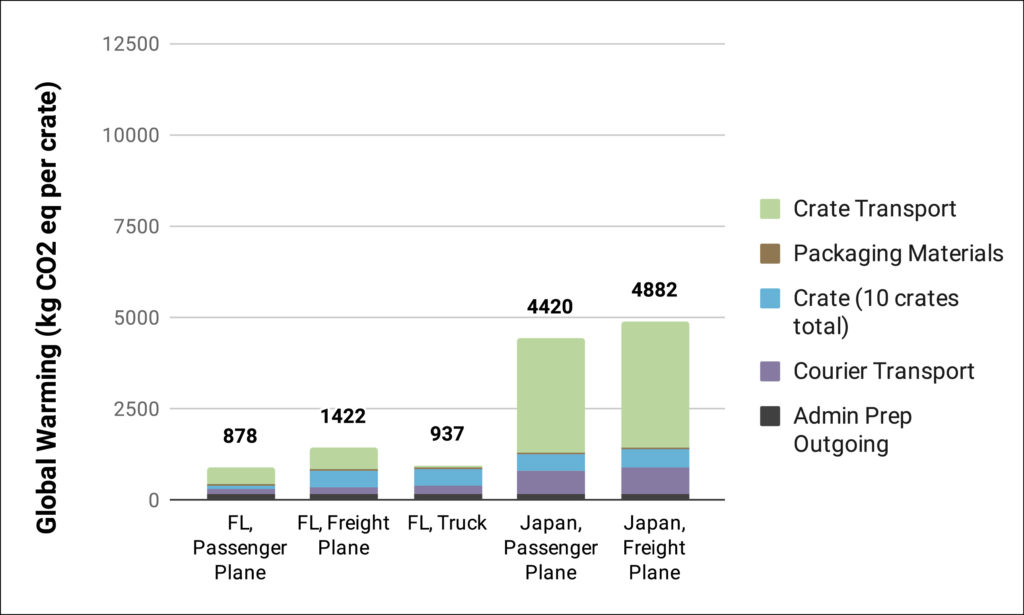
Figures 3a, 3b, and 3c display the carbon footprint of outgoing loans as a function of the transportation method (passenger/freight plane or truck) to the final destinations of Tampa, Florida and Nagoya, Japan. Analyses were conducted for one courier traveling with one, five, and ten crates. According to the MFA practices in 2013, a typical museum loan scenario involves a courier traveling with five to ten crates and the courier making two round trips for each crate round trip. By adjusting the number of crates traveling with one courier and normalizing per crate, only the courier transport emissions data change; administrative work, crate assembly, packing materials, and crate transport emissions per crate all remain the same. Carbon emissions from the packaging materials required for each crate were estimated at a constant 51 kg CO2 eq, making this the smallest emission for each travel scenario.
The single crate outgoing loan scenarios (Figure 3a) have the largest carbon footprints of all outgoing loan scenarios. The travel scenario with the smallest carbon footprint is to Tampa, FL by passenger plane with 2,286 kg CO2 eq; and the largest carbon footprint is to Nagoya, Japan via freight plane with 11,497 kg CO2 eq. Even the outgoing passenger plane to Tampa, FL emissions are larger than the total emissions of 2,234 kg CO2 eq for the incoming loan. Courier travel is responsible for roughly 50% of the emissions for Tampa, FL by passenger plane and about 64% of the emissions for Nagoya, Japan by freight plane travel.
For each set of the outgoing crates, travel to Japan via freight plane has the largest carbon footprint. Five crates result in a total of 5,617 kg CO2 eq (Figure 3b) and ten crates have 4,882 kg CO2 eq (Figure 3c). Reduced emissions result when a courier is able to travel with more than one crate at a time. For travel to Tampa, FL by passenger plane, the five crate scenario reduces the carbon footprint by 40% and the ten crate scenario by 45% . Similarly, travel to Nagoya, Japan by freight plane results in the carbon footprint being 51% smaller for five crates and 58% smaller for ten crates. Because the emissions for the courier are being spread out over more crates, the crate assembly and transportation steps have relatively larger contributions than the courier travel for the ten crate scenario.
These results have clear implications for decarbonizing loan practices. Where possible, having individual couriers responsible for more objects in a loan reduces the number of couriers that are traveling. Another approach is to eliminate courier travel completely by using pairs of “book-end couriers” that deliver and meet loans at either end but do not travel themselves, a trend that has become more prevalent since the publication of the original JAIC (2016) article.
Once courier travel has been reduced as much as possible, the next most impactful change is to reduce freight transport involved in loans. This result has been recognized by other carbon footprinting efforts such as the Gallery Climate Coalition, who in response have launched a Sustainable Shipping Campaign to raise awareness and provide guidance for museums, collectors, insurers, and shippers to decarbonize shipping.
PROJECT TEAM
Authors: Grace Filley, Sarah Sanchez, Matthew Eckelman – Northeastern University Department of Civil & Environmental Engineering
Collaborators: Sarah Nunberg – Pratt Institute
Sarah Sutton – Environment and Culture Partners
Figures and illustrations: Varnika Kundu, Hyunah Oh, Eric O’Toole, Shraddha Ramani
PROJECT HISTORY
Organized efforts to introduce LCA to U.S. cultural heritage preservation professionals began in 2012 with a series of six LCA case studies conducted as a collaboration between conservators and environmental engineers, in partnership with the MFA Boston. FAIC was awarded a Tier I grant in 2016 and a Tier II grant in 2020 from the National Endowment for the Humanities to expand the case study research and develop a carbon calculator for individual materials under the project Sustainability Tools in Culture Heritage, STiCH,13 available to visitors to the AIC website.14
References
atelier10. 2021. “Harold Ancart at David Zwirner Carbon Emissions Report”.
https://www.davidzwirner.com/harold-ancart-emissions-report
Environmental Paper Network. 2021. “Paper Calculator: presented by environmental paper
network.” https://c.environmentalpaper.org/
Fava, James A., and Society of Environmental Toxicology and Chemistry. 1991. A technical framework for life-cycle assessment: workshop report. August 18-23, 1990. N.p.: SETAC.
Gill, A., “Net-zero Picasso: Museums rethink art shows to cut climate impact” World Economic Forum, June 22, 2022; https://www.weforum.org/agenda/2022/06/art-museums-cutting-carbon-emissions/
International Organization for Standardization. 2006. Environmental management – Life cycle assessment – Requirements and guidelines. 2006-07-01 ed. International Standard, ISO 14044. Geneva: ISO. https://www.iso.org/standard/38498.html.
Nunberg, S., Eckelman, M.J., Hatchfield, P. 2016. Life cycle assessments of museum loans and exhibitions: Three case studies at the Museum Fine Arts, Boston. Journal of the American Institute for Conservation 55(1), 2-11. doi: 10.1080/01971360.2015.1112465
sphera. 2020. “GaBi Packaging Calculator – Sustainable Packaging Design.” https://gabi.sphera.com/international/software/gabi-envision/gabi-packaging-calculator/
United Nations Environment Programme (UNEP). 2005. Life Cycle Approaches: the Road from Analysis to Practice. N.p.: UNEP/SETAC, Life Cycle Initiative, Paris.
United States Environmental Protection Agency. 2012. “Tool for Reduction and Assessment of Chemicals and Other Environmental Impacts (TRACI).” https://www.epa.gov/chemical-research/tool-reduction-and-assessment-chemicals-and-other-environmental-impacts-traci
Vignon, Bruce W., D. Tolle, B. Cornaby, H. Latham, C. Harrison, T. Boguski, R. G. Hunt, and J. Sellers, and USEPA. 2020. “Life-cycle assessment: Inventory guidelines and principles.” N.P.: CRC Press.