What IS Life Cycle Assessment?
Life Cycle Assessment (LCA) is a modeling tool for quantifying the environmental impacts of products and processes. It is used to assist companies, consumers, and policy-makers in greening their practices and decisions. For example, LCA results can tell us if one product is environmentally preferable to another, or what aspects of a product are contributing most to environmental impacts. LCA methods and the science that underpins them have been developed over the past 50 years and are supported by international standards and a large community of researchers and practitioners around the globe. Many popular tools fall under the “umbrella” of LCA and use closely related methods, including carbon footprinting and water footprinting. LCA enjoys widespread use, with practitioners across all types of sectors and institutions, including increasingly in cultural heritage, to evaluate practices, choose green products, and point to opportunities for environmental improvement.
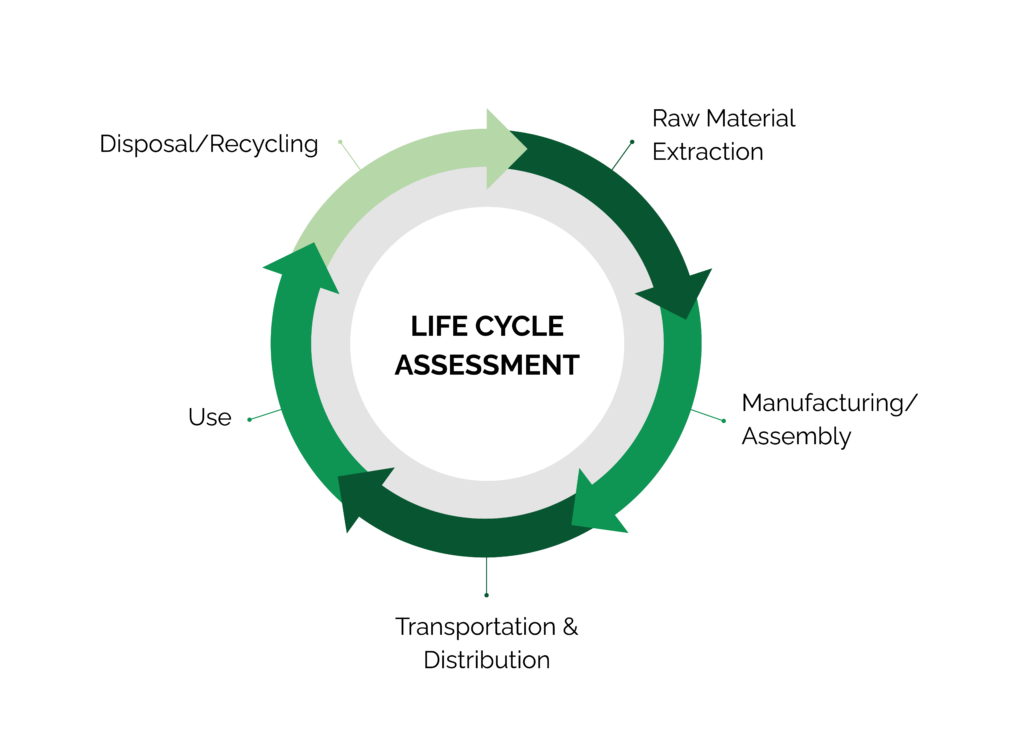
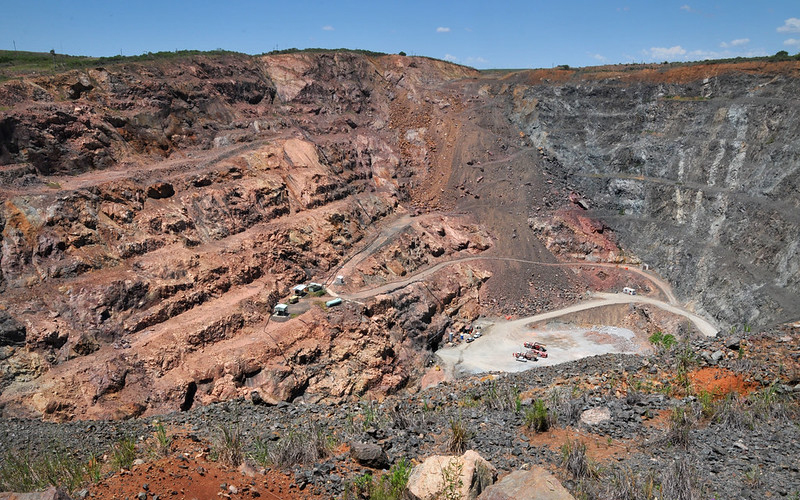
LCA are part of a suite of techniques used to assess sustainability, including risk analysis, exposure assessment, life cycle costing, and techno-economic assessment. What sets LCA apart from these other tools is that it considers environmental impacts that occur over the entire technological life cycle of a product or process. The life cycle of a product is defined by several life cycle stages (Figure 1). The first stage is raw material extraction, where resources are gathered from nature through mining, drilling, or harvesting. Next, the raw materials are refined during material production. Materials then enter assembly or product manufacturing, where different materials are combined and packaged. The product then enters the use stage, which may last decades for durable products or just a few minutes for consumables. Finally, the product enters its end-of-life, where it may be recycled, repurposed, or treated and disposed. As the product moves along its technological life cycle, transportation is typically required between each of the stages.
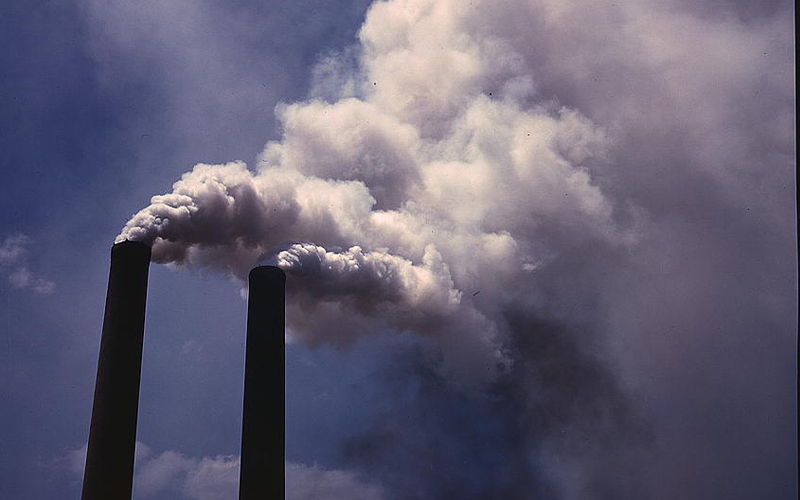
LCA quantifies resource requirements (such as water or energy) and pollution from each life cycle stage, and the resulting environmental impact. For example, an LCA for a solvent will consider emissions during its production from petrochemical or biological feedstocks, packaging and transportation to a warehouse or retailer, storage, further transportation to the point of use, any evaporation that occurs during use, and end of life options such as recycling or disposal. In this way, LCA provides a holistic picture of where emissions are taking place and how products and processes might be improved at each stage in order to minimize environmental and social impacts. Rather than focusing only on the physical product, LCA recognizes that products live within a larger technological system, and that the greatest drivers of environmental damage are often indirect.
What Goes Into an LCA?
LCAs are carried out under the International Organization for Standardization (ISO) 14040:2006. This standard specifies the technical and documentation requirements of an LCA, organized into four phases that must be carried out in any compliant study.
1. Goal and Scope Definition. During this phase, the client and LCA practitioner work closely to define the fundamental questions that the assessment will address and how they will carry out the study. First a study goal is set, including the purpose of the project and how the results will be used. A typical goal is to evaluate the environmental performance of a product or process, and/or to compare options. But how to compare? For each option, a common functional unit is defined, which describes the service being provided and establishes a quantitative basis of comparison for the entire study. Each option being compared is then scaled into a reference flow that delivers that common functional unit. For example, in comparing the impact of plastic bags to paper bags, it is not appropriate to simply compare one bag to another because they have different capacities (say 5 and 10 liters, respectively). So, first a common functional unit is defined, say 10 liters of capacity, and the reference flows would be 2 plastic bags versus 1 paper bag.
Once the study parameters are set, the LCA practitioner works with the client to decide the system boundary, essentially what types of inputs, processes, and emissions should be included in the study. This should be done in a way that serves the study goal, making sure that nothing is excluded that is likely to have a major influence on the results. Other aspects that are difficult to obtain data for and are likely to have a negligible influence can be excluded, as long as these assumptions are documented. For example, examining the life cycle of a cup of coffee could include transporting coffee beans but might exclude the emissions associated with building the roads that are used, as many other vehicles use these as well. Finally, the team decides on requirements for data quality and modeling approaches.
2. Life Cycle Inventory (LCI) Analysis. The LCI is a list of all of the flows of resource inputs and emissions outputs that occur in producing the reference flow of each product option. This is also the data collection phase. To compile the LCI, the LCA practitioner will first gather direct information from where the item is produced or used, such as how many tissues are used in a particular treatment. These direct quantities are called foreground data, but they only reflect the quantities being used directly and not the entire life cycle. In order to link the quantity of tissues with all of the emissions that occur throughout the supply chain of those tissues, LCA practitioners will link foreground data on usage with background data from LCI databases. These background data are based on decades’ worth of in-depth studies that have investigated the supply chains of thousands of materials and products and counted all of the inputs and emissions along the way. These investigations are extremely time-consuming, so using LCI databases is a way to build on what is already known. There are various LCI databases compiled by governments (e.g., the U.S. LCA Commons) and commercial entities (e.g., ecoinvent). In the STiCH project, conservators and engineers worked closely to define reference flows for each conservation item of interest, collected foreground data from manufacturers and practitioners, and then linked to background data from the ecoinvent database.
Once all of the data have been linked together, an algorithm scales all of the flows in the product system according to the amounts needed to produce the final reference flow. The product system can be quite complex. Considering tissues, for example, the product system might include emissions from processing wood into pulp, from transporting logs to the pulping plant, from making the fuel that the trucks run on, from making the trucks themselves, and on and on up each branch of the supply chain. The final, scaled set of resource inputs and emissions is called the life cycle inventory.
3. Life Cycle Impact Assessment (LCIA). This phase tells us how each of the flows in our life cycle inventory affects the environment. There are multiple ways that our activities are affecting the planet and our health, these are called impact categories. Examples include global warming, depletion of the ozone layer, and ecotoxicity. Each flow is classified according to whether it causes a certain impact. For example, nitrous oxide (N2O) causes both global warming and ozone depletion. Then it is assigned a value, or characterized, according to how potent a substance it is for each type of impact. This is called a characterization factor (CF) and is expressed relative to an indicator substance. In the case of global warming potential, we measure CFs relative to carbon dioxide, and so all greenhouse gases are characterized in units of carbon dioxide equivalents (CO2eq).
Characterization relies on integrating models from environmental science, chemistry, physics, ecology, toxicology, and other fields in order to create a causal chain that links an emission in a particular location to the physical changes and damages that it causes all over the world. If some treatment chemical is disposed of in wastewater, we want to be able to understand how the chemical is transported through waterways, is transformed or degraded, comes into contact with aquatic organisms, and causes harm through ecotoxicity. Most of these integrated models are developed by scientific research organizations within government labs and universities. These organizations will compile a suite of models that correspond to each impact category that it deems important. Together, this collection is called an LCIA method.
In the United States, the Environmental Protection Agency developed the most commonly-used LCIA method, called Tools for Reduction and Assessment of Chemicals and other environmental Impacts (TRACI). This is the LCIA method used in all of the STiCH tools. TRACI (v2.1) includes 10 impact categories (see the full list in the Appendix below), including global warming that is the primary focus of STiCH carbon calculator, while the case studies include the full list. Which impact categories are included in a study should be in line with the study Goal and can be decided by the LCA practitioner and client.
Because LCA compares options across multiple sustainability indicators, results typically have different units. It can be useful to normalize results across impact categories into relative units, for example as a proportion of a person’s average annual impacts, or further weight results into a single score so that product options can be compared more easily.
4. Interpretation. This last and most important phase of LCA is where results get translated into knowledge and recommendations. If Option A has lower impacts than Option B across all impact categories, then this supports a clear preference. But it frequently happens that one product option has higher impacts for some indicators, but lower for others. The LCA practitioner will discuss these different trade-offs in the context of the study Goal, leaving the final decisions to the client.
In many cases an LCA is motivated by a desire to improve designs and practices. These studies will include a contribution analysis to tell which processes or hot spots are driving results for different impact categories, in order to suggest where to focus efforts. If a particular material is driving impacts (such as foams in the Crates Case Study), then designers might investigate low-carbon alternatives or ways to reduce how much material is used. If a particular upstream process is the main culprit (such as electricity generation), then managers might work with suppliers to source a greener option (through renewable energy contracts for example).
LCA is not an exact science – there are various assumptions that are a part of every study, as well as inherent uncertainty in model parameters such as material quantities and emissions factors. It is critical to indicate the quality of the underlying data and their implication on the certainty of the results. For instance, if an LCA uses emissions factors that are 5 years old, then this must be clearly documented and its implications discussed, especially if in reality the emissions have improved. LCA studies often include a sensitivity analysis, where various assumptions are changed, such as the source of electricity or the quantity of materials required, in order to see how much the overall results respond. If the results are found to be very sensitive to a single parameter, then this parameter should be further investigated to ensure that the study uses the most accurate and up-to-date data possible. Even an alternate functional unit might be tested. In the Loans Case Study, shifting the functional unit from one loan to the number of views per object in each location had a dramatic influence on the results, changing the order of preference. LCA studies might also include a formal uncertainty analysis, which provides a statistical range of results.
Overall, the Interpretation Phase provides context to the study so that readers can fairly interpret the results and make educated choices.
What Are Some Limitations to LCA?
LCA supports complex choices and empowers the consumer with new information so the individual can effectively reduce their environmental impact. LCA focuses on environmental considerations, but in reality a range of important aspects affect decisions, including costs, time, space constraints, aesthetics, and many others. So, LCA studies provide one layer of information to allow for informed decision-making.
Not all types of environmental impacts are included in LCA either. LCIA methods use models where the science is well-developed enough to establish a scientific consensus on a causal chain between emissions and impacts. There are some environmental issues where the science and characterization models are still being developed and so are not yet routinely included in LCA studies, such as antibiotic resistance, endocrine disruption, or the impacts of marine plastics. This doesn’t mean that these issues are not important, and certainly they can be discussed qualitatively in an LCA in order to provide more context for decision-making.
LCA can compare material types, but small differences between similar materials may not become evident using LCA, even though they might be important to conservation practitioners or other professionals. For example, an acrylic emulsion paint may not differ substantially in impact from one manufacturer to another (Liqutex similar to Golden’s) and different colors of acrylic emulsion paint will not vary unless one color contains specific hazards, such as cadmium. Unless product differences are reflected in their material compositions, the results will be similar.
Like all models, LCAs are just a representation of reality – they cannot perfectly capture every detail. As the aphorism goes, “all models are wrong, but some are useful.” We should not expect that LCA results will provide perfect information on the absolute carbon footprint of a product; models can always be improved and circumstances on the ground are constantly in flux. LCA models are only as good as the data that go into them, and the data in LCI databases are often a few years old. So, the best that can be done is to follow standards and document assumptions so that results can be reproduced in future iterations. However, if performed using consistent data and assumptions, LCAs can be very useful in comparing relative results between options and in finding which materials or processes are most important.
Key Terms/Definitions (adapted from ISO 14040:2006)
Goal: Defines the overarching question addressed in the LCA.
Scope: Outlines the system of the LCA, determining aspects of the life cycle of the product or action included (and excluded) in the study. The scope is set by the system boundaries.
Cradle to grave: The life cycle of a product from initial resource extraction through manufacture, transportation, use, and disposal.
Cradle to gate: The life cycle of a product including only initial resource extraction through manufacture (ending at the factory ‘gate’).
Input: Any product, material or energy flow that enters a product system.
Output: Any product, material or energy flow that leaves a product system, including emissions to air, water, and soils, solid wastes, coproducts and other releases.
Inventory: The compilation and quantification of inputs and outputs for a product
throughout its life cycle.
Impact Assessment: Evaluation of the magnitude and significance of the potential environmental impacts for a product system throughout the life cycle of the product.
Interpretation: Discussion of the findings of the inventory analysis and/or the impact assessment,or both in relation to the defined goal and scope, in order to reach conclusions and recommendations.
Functional Unit: Describes the primary function(s) fulfilled by a product system, and indicates how much of this function will be considered in the intended LCA study. The functional unit enables different physical systems to be treated as functionally equivalent.
Reference Flow: The physical product(s) necessary to deliver the functional unit.
Impact Categories: A set of environmental issues used to group substance emissions into measurements quantifying the respective impacts on global or local environments. Impact categories included in the TRACI impact assessment method are listed below.
Category Indicator: The units used to measure environmental impacts in each impact category, typically expressed as equivalents of a reference substance.
LIFE CYCLE ASSESSMENT IMPACT CATEGORIES
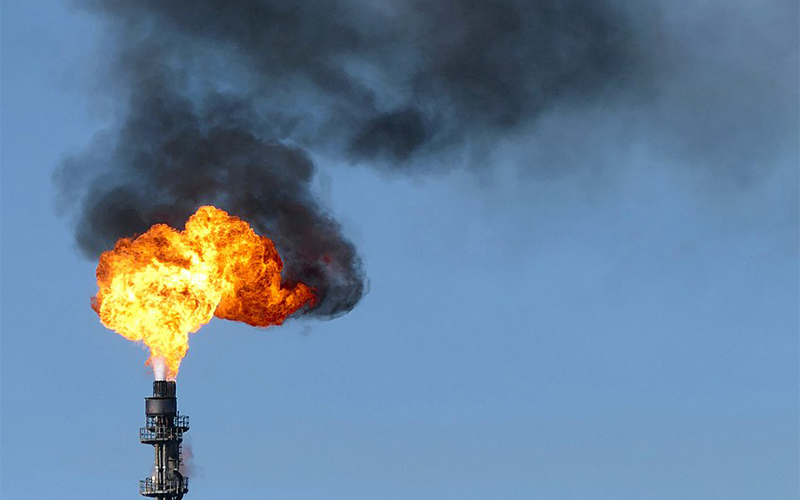
Global Warming Potential (GWP100): Impact category that indicates the radiative forcing (heat trapping potential) associated with greenhouse gases (GHGs) including carbon dioxide, methane, nitrous oxide, and fluorinated gases (F-gases). Measured in carbon dioxide equivalents (CO2 eq) over a 100-year period. This is a global impact category (meaning the location of emissions does not matter) and the most commonly used measurement of environmental sustainability. The STiCH Carbon Calculator is based on this impact category.

Acidification Potential (AP): Impact category that indicates the potential acidification of water and soils due to acid rain, formed by reaction of emissions such as sulfur and nitrogen oxides with water in the atmosphere. Measured in sulfur dioxide equivalents (SO2 eq). Acid rain has led to major damages to terrestrial and aquatic ecosystems, as well as to outdoor cultural heritage displayed outdoors.
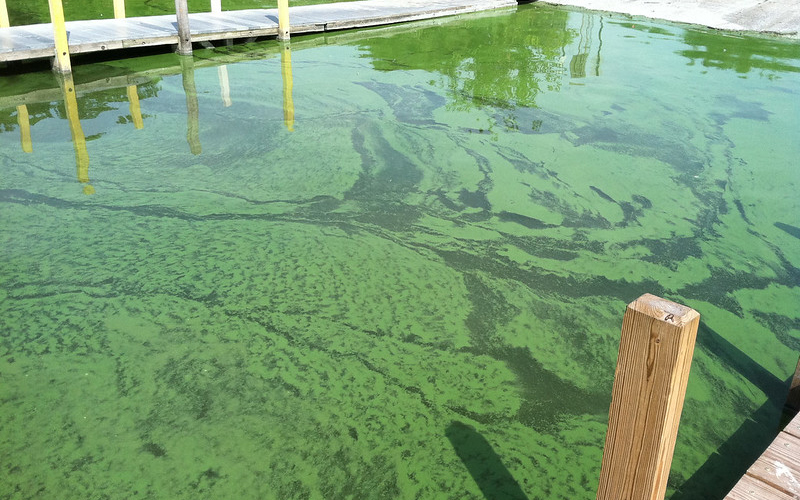
Eutrophication Potential (EP): Impact category that indicates the potential for reduced amounts of oxygen in water due to nutrient pollution of nitrogen and phosphorus. Measured in phosphate equivalents (PO4 eq). Excess nutrients cause blooms of algae, which then decompose and consume dissolved oxygen, leading to hypoxia (shortage of oxygen) for aquatic organisms. Eutrophication can lead to declines in the health of fish and shellfish populations, including mass die-offs, loss of seagrass beds, and ecological changes in food webs.
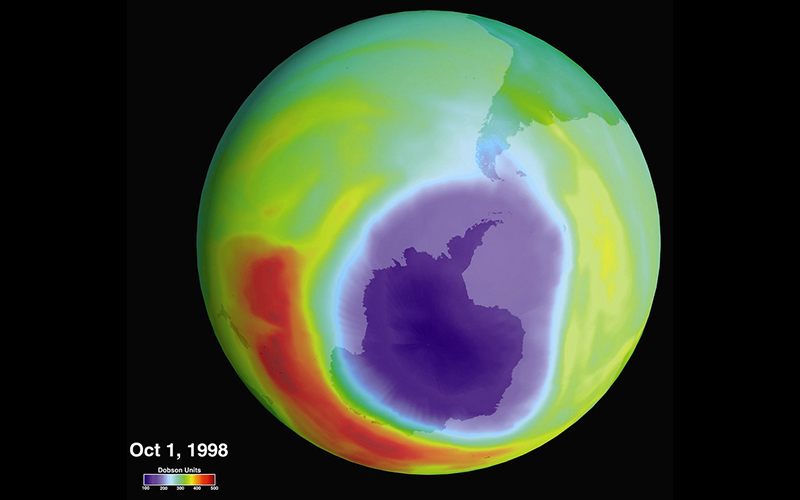
Ozone Depletion Potential (ODP): Impact category that indicates the potential for destruction of ozone in the stratospheric ozone layer. Measured in equivalents of the once-common chlorofluorocarbon refrigerant CFC-11 (CFC-11 eq). The ozone layer shields the surface of Earth from most ultraviolet radiation, protecting humans from skin cancers and eye disease. Emissions of ozone-depleting substances have been drastically reduced over the past several decades under an international agreement called the Montreal Protocol (1987).

Photochemical Smog Formation Potential: Impact category that indicates the potential for formation of tropospheric (surface-level) ozone due to reactions of nitrogen oxides and volatile organic compounds (VOCs) in the presence of sunlight. Measured in non-methane VOC equivalents (NMVOC eq). Tropospheric ozone is considered a major air pollutant and can cause serious health effects as well as damages to crops and cultural heritage (http://www.getty.edu/publications/virtuallibrary/0892361263.html).
Human Health Particulate Matter: Impact category that indicates the potential for emissions and secondary formation of particulate matter (PM). PM comes in a range of sizes and chemical compositions and is the most harmful form of air pollution worldwide, causing millions of premature deaths annually. PM comes in two common size fractions, PM10 (less than 10 microns in diameter) and PM2.5 (less than 2.5 microns in diameter), the smaller size being more impactful to human health. Measured in PM2.5 equivalents (PM2.5 eq).

Human Health Cancer and Non-Cancer: Two impact categories that indicate the potential for chemical emissions to cause disease in humans. Measured in Comparative Toxicity Units for humans (CTUh), derived from the international consensus USEtox model.
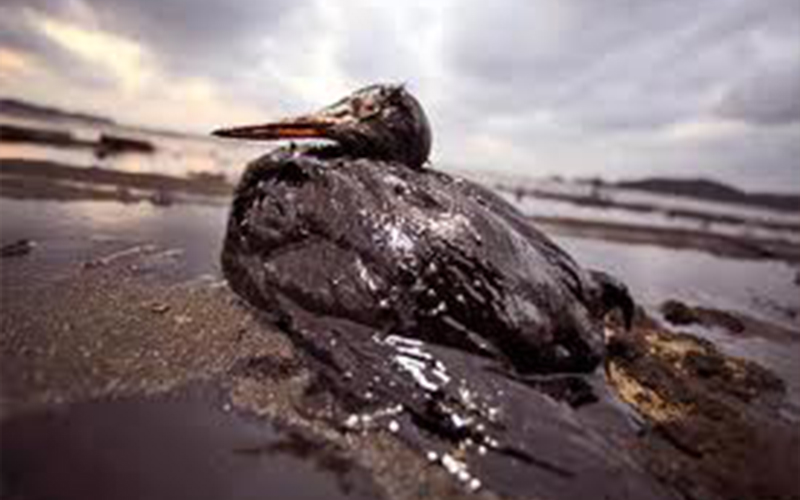
Ecotoxicity: Impact category that indicates the potential for chemical emissions to cause damages to non-human organisms. Measured in Comparative Toxicity Units for ecosystems (CTUe), derived from the international consensus USEtox model.
Resource Depletion: Impact category that indicates the potential for depletion of non-renewable resources, in particular fossil fuels. Measured in primary energy megajoules (MJ). In other LCIA methods, this impact category is often broadened to include all primary energy use.
Resources/References/Links/ Where to go for more Information
Curran, M.A., Environmental Life-Cycle Assessment, New York: McGraw-Hill, 1996.
Guinée, J., et al., Handbook on Life Cycle Assessment – Operational Guide to the ISO Standards, Dordrecht, The Netherlands: Klewer Academic Publishers, 2002.
Guinée, J., et al. “Life cycle assessment: Past, present, and future.” Environmental Science and Technology 45.1 (2011): 90-96.
Matthews, S. et al. LCA Textbook. http://www.lcatextbook.com/
https://www.globallcadataaccess.org/become-a-dataset-provider
https://www.epa.gov/sites/default/files/2015-04/documents/ch3.pdf
UNEP-SETAC. Life Cycle Initiative. https://www.lifecycleinitiative.org/wp-content/uploads/2013/06/Module-e-Impact-assessment.pdf
Berners-Lee, M. How Bad are Bananas? The Carbon Footprint of Everything.Greystone Books Toronto, 2011.
Kagan, Sacha Art and Sustainability https://edisciplinas.usp.br/pluginfile.php/2942098/mod_resource/content/1/livro-sascha.pdf
Acknowledgments/Contributors
Sarah Sutton, Principal Investigator for STiCH, and CEO, Environment and Culture Partners.
Sarah Sanchez, Doctoral Candidate, Civil & Environmental Engineering, Northeastern University.
Varnika Kundu created the LCA circulating image.